The Quick and Easy Free Data Visualization Tool
Identify trends, reinforce an argument, tell better stories with engaging and easily digestible data! No data analysis experience required.

Unlock data insights for free
Information is power. Get started with one of our sample datasets and see how Vizdium can work for you.
Sales Records for a B2C Company
200 rows • 9 columns
Happiness Survey Data
50 rows • 11 columns
Famous Iris flower dataset from Ronald Fisher
150 rows • 5 columns
HR Case Study
875 rows • 9 columns
S&P 500 Stock Market Index Daily Historical Data
309 rows • 7 columns
Analyze your own dataset
Intuitive data visualization software
Deliver value through your communications with our modern and simple features.

Smart Guides
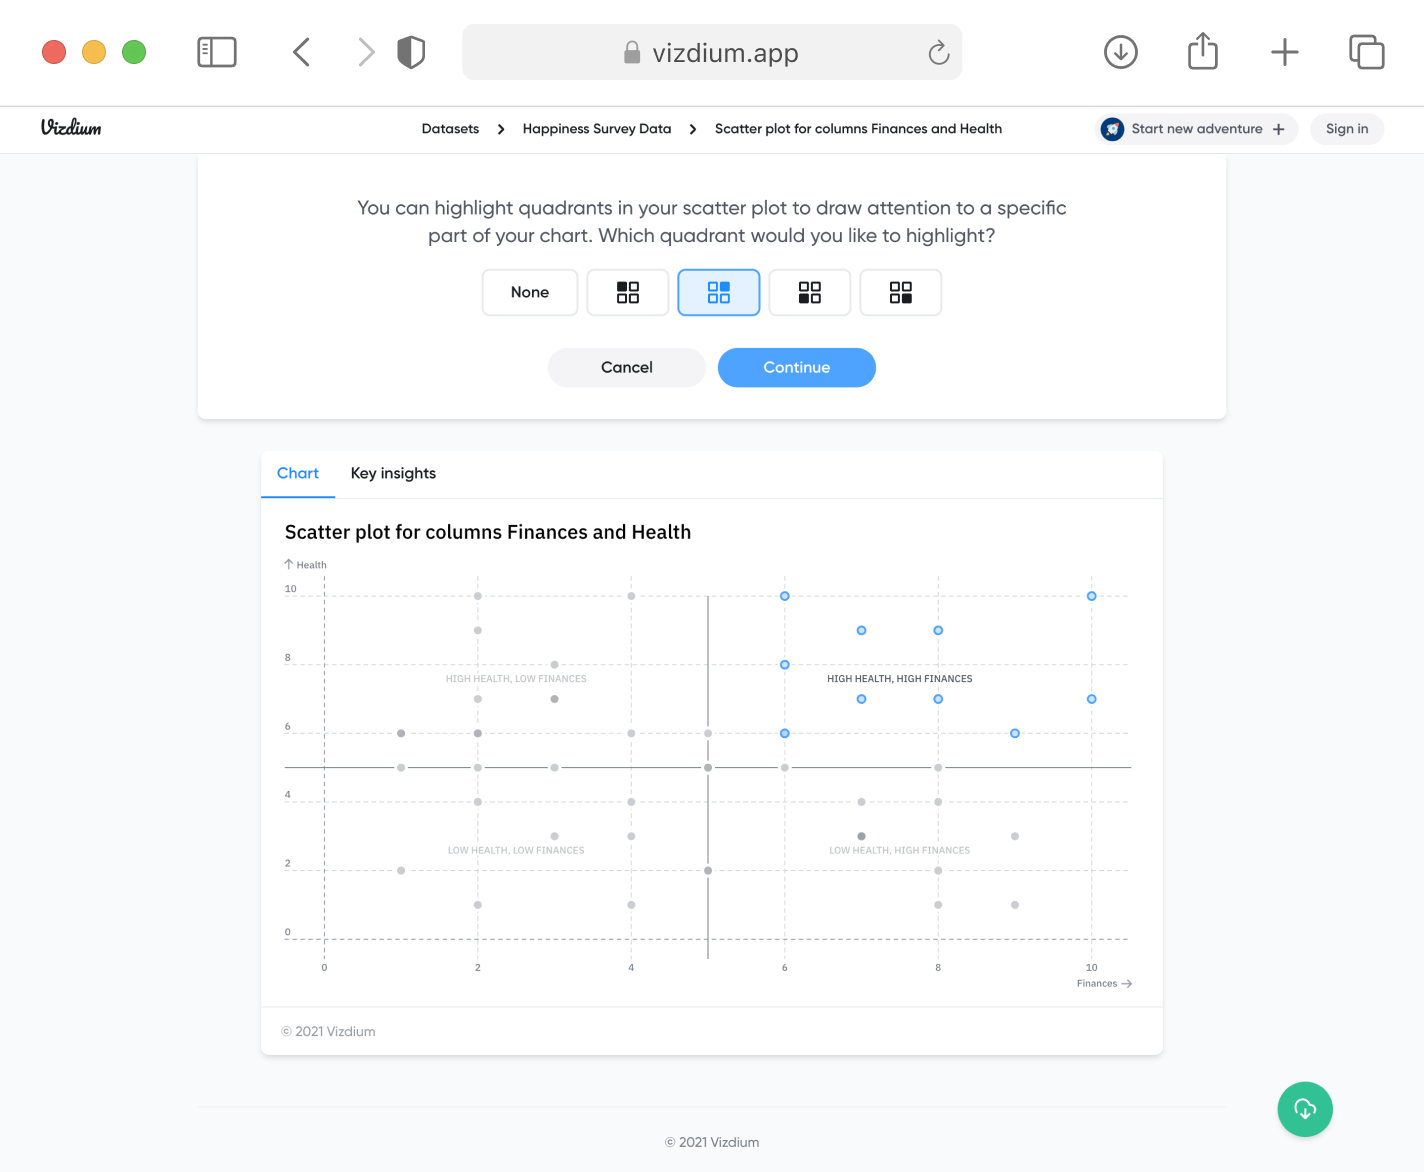
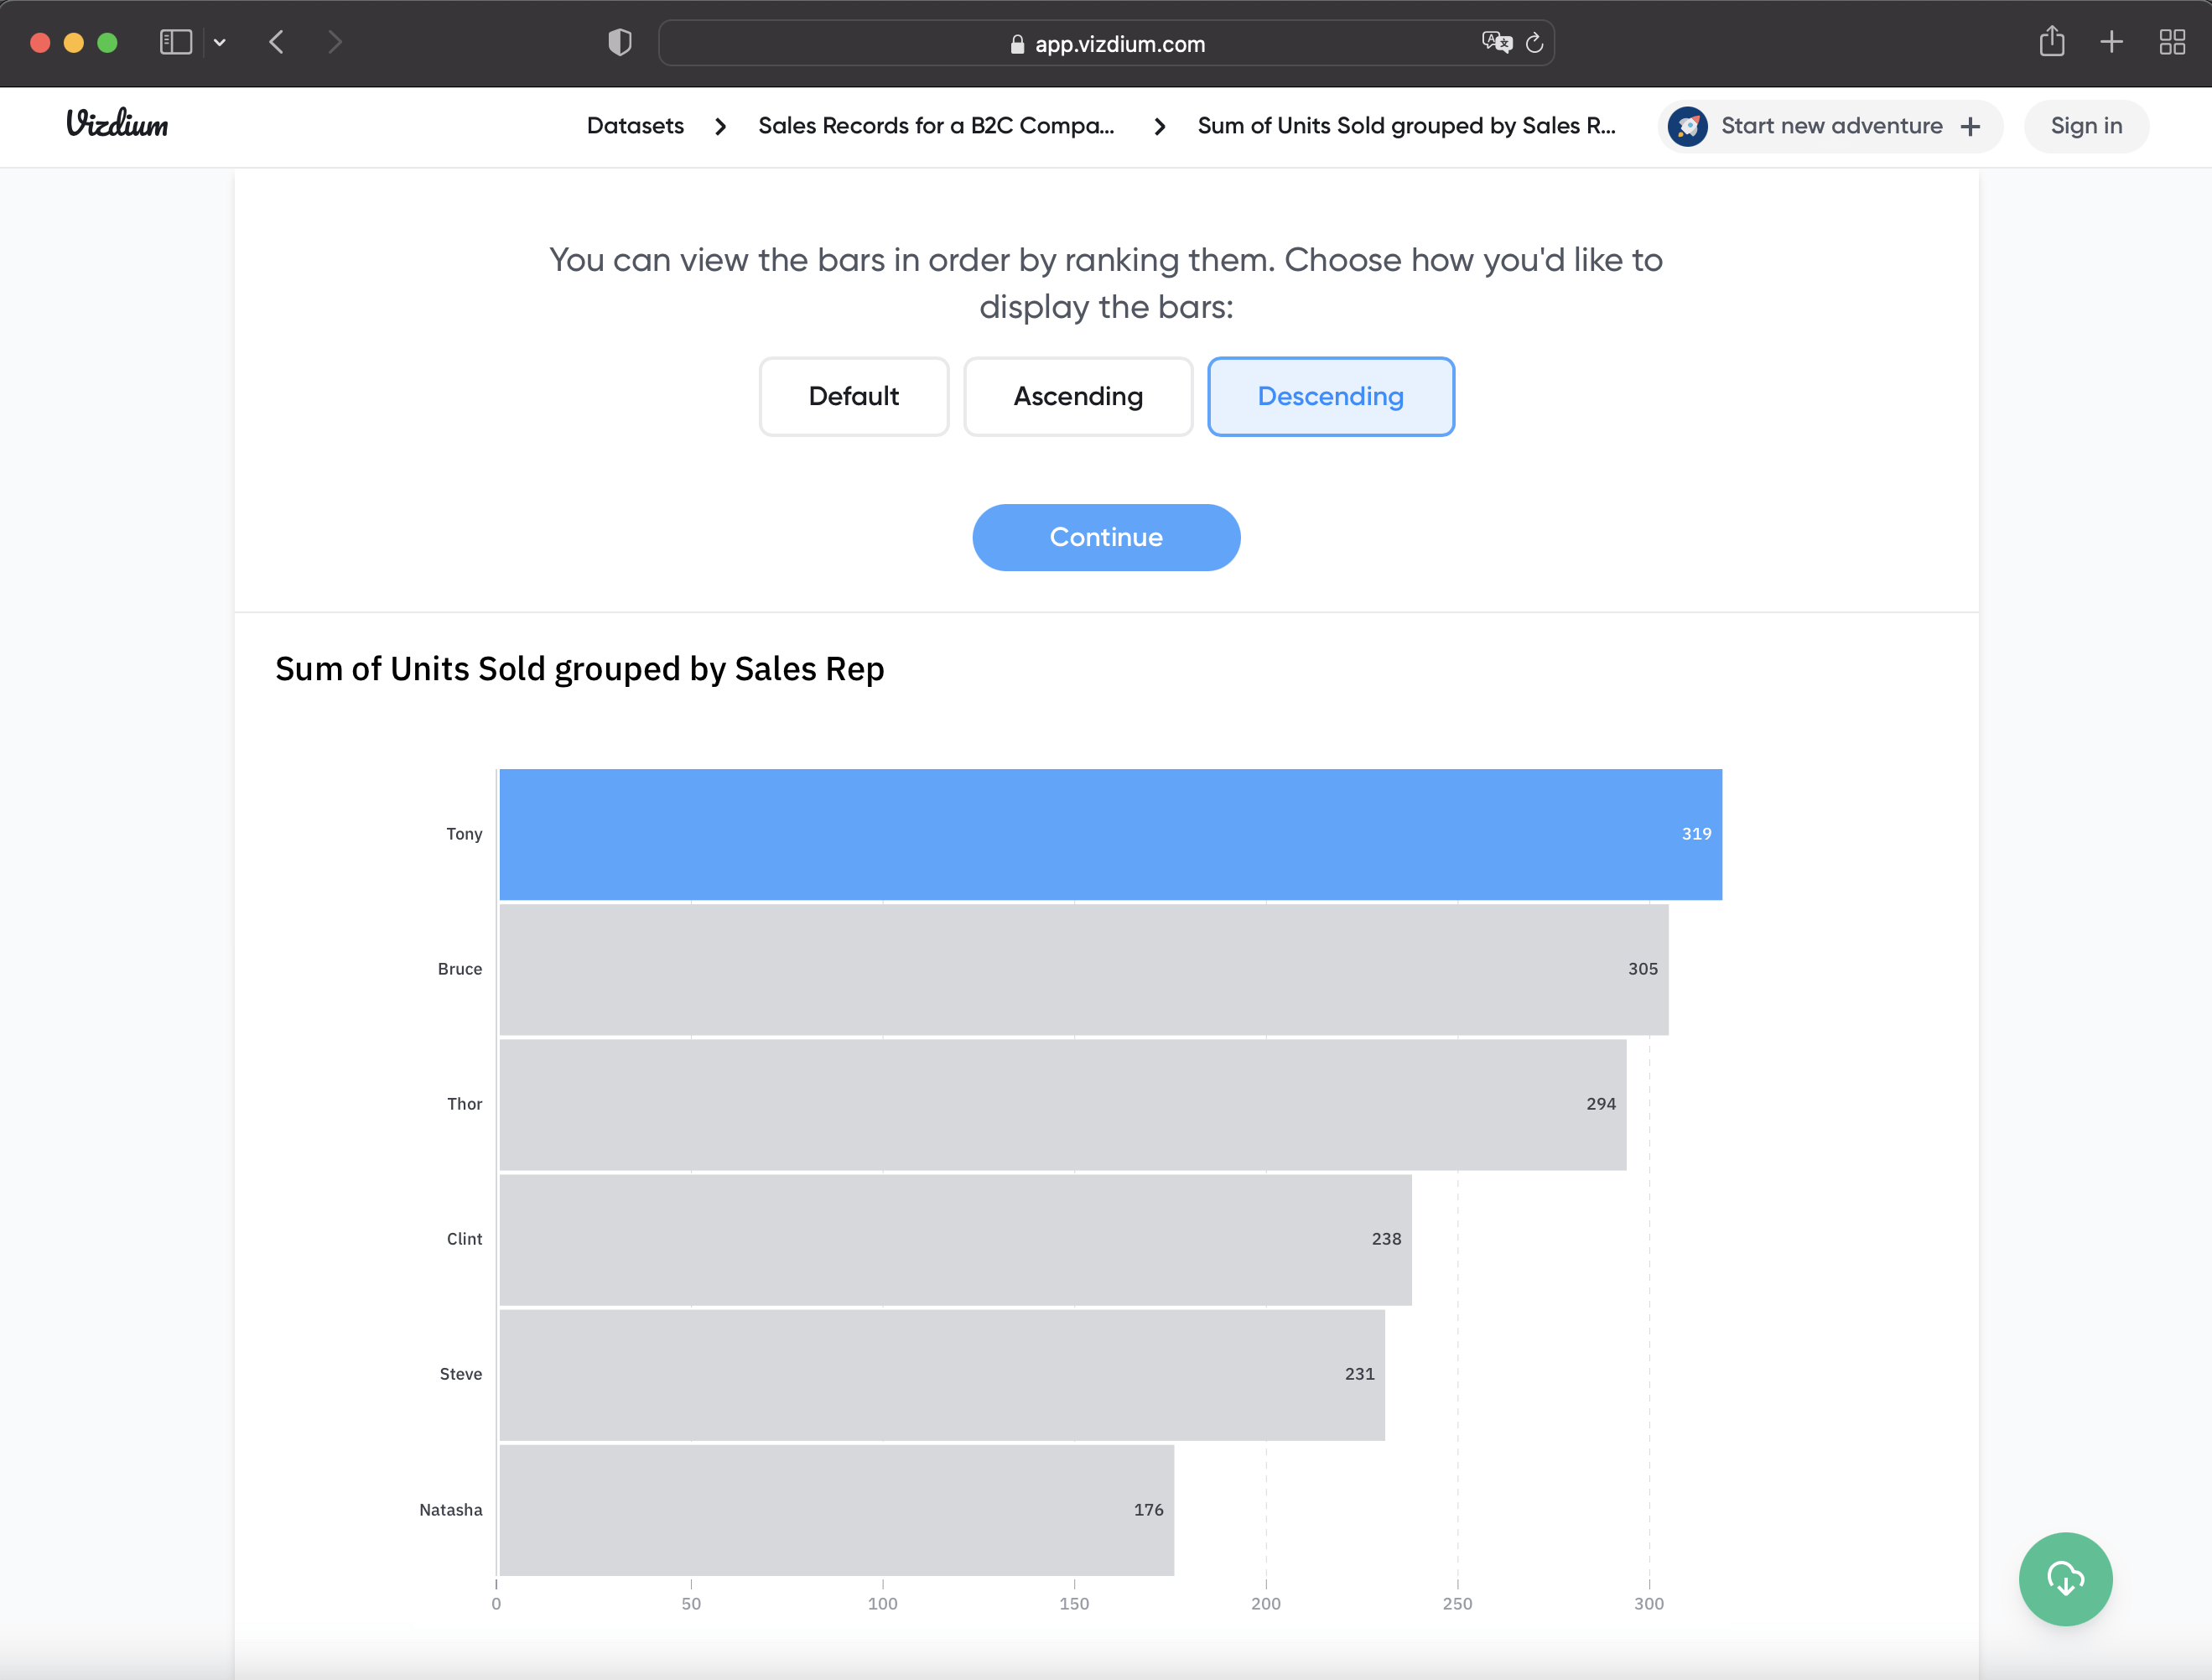
Explore your data with the help of an AI-enabled smart assistant. We'll guide you step by step from data to insights.

Charts and Graphs
Explore a variety of charts and visual models to export your data. Visualize as a barplot, heat map, scatter plot, histogram and more.

Download & Share
Download your data insights and charts, or export them to other applications. No sign-up or payment required.
How to Start Analyzing Data in 6 Simple Steps
- Click “Get started”, no sign-in is required.
- Upload your own data or choose one of the sample ones we offer.
- Within the preview, edit any column header to help us analyze your data better.
- Start your journey by either choosing from a list of suggested combinations, or making your own custom chart.
- Add extra details (like columns, values or preferences) that we might suggest to improve your visual model. Depending on your data visualization model, we’ll help you find the best way to display your data.
- Get your visual insights! And export them in SVG or PNG format and share your valuable insights with the world!

Don’t know where to start analyzing your data? Let Vizdium make it easy for you!
Get started for free© 2022 Vizdium